Raven Trader Bot Documentation
Introduction
This project is focused on building a trading bot that trades stocks on behalf of a user. The system uses day trading strategies since the system can tested and proft/loss can be realized quickly. It’s an ongoing project and this documentation will show the completed features. To understand this system, It’s necessary to have a basic understanding on how stock market works.
What i used to build the system
- Web Client to view the trades by the bot. used react.js
- Anaconda with python 2.7
- External python libraries
- alpha_vantage provides time series stock prices in 1 min, 2 min, 5 min interval.
- Beautiful Soup used to scrape websites to pick daily stocks.
- pandas to wrap data in a dataframe for easier data manipulation.
- matplotlib for plotting and other finance calculations
How The System Works
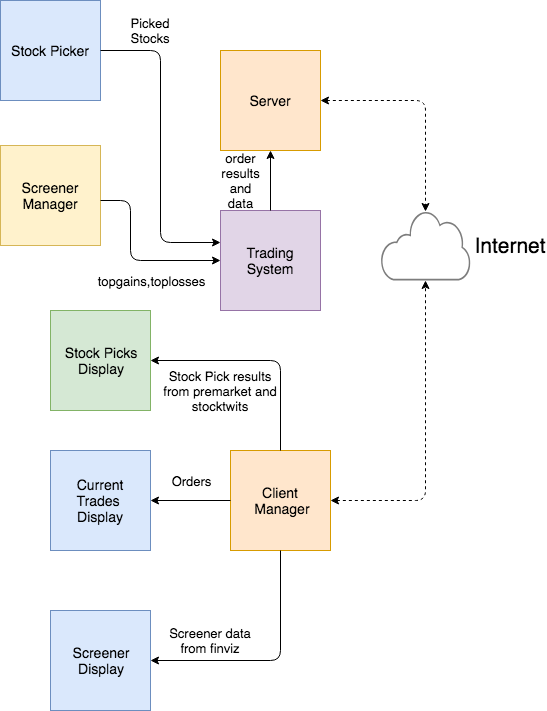
In the above design, the client manager is the webclient that the user can use to see what is going on in the trader system. The user can view current trades, stock picks and screener data i.e. stocks being bought or sold in high volumes, stocks whose price is increasing or dropping dramatically etc. For the time being the user can’t do anything on the web app except see what is going on.
The server side is where the real work is done. First we have a stock picker that is used to pick stocks daily from multiple sites which have higher potential for profit. Next we have screener manager which is used to list stocks displaying some characterstics like big price change, volume spike etc. Finally we have a trading system where the system fetches all the information needed, analyze using trading strategies and submits orders(buy/sell/short/cover) to the broker simulator.
Stock Picker
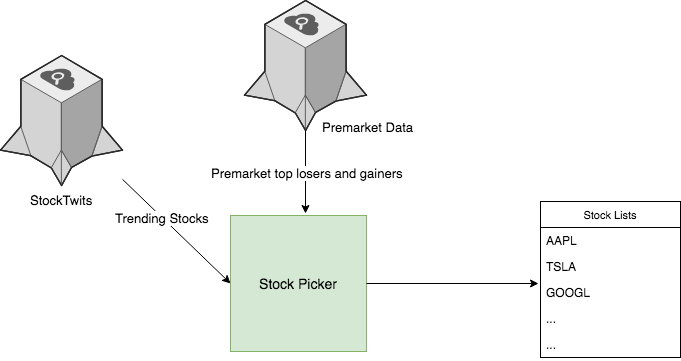
One of the many ways to find stocks that have better probability of making profits is to find the stocks that many people are looking at. To find these stocks one can go to stocktwits.com to find trending stocks and investing.com to find stocks that did well premarket trades. After the system grabs those data, it searches for stocks that occur in both stocktwis and premarket data the outputs a list of the stocks.
Screener Data Picker
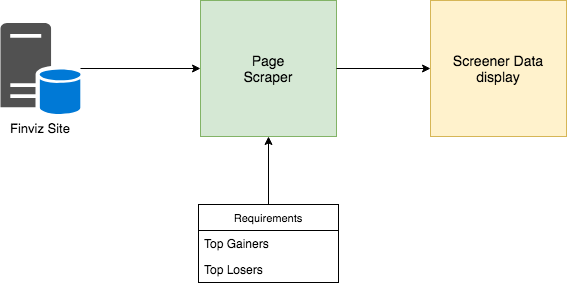
I use finviz website to fetch stocks that have high volatile,high price change and high volume every 15 minutes after trading is started (9:30 AM). And the stocks are displayed in the webclient and also used in the trader.
The Trader
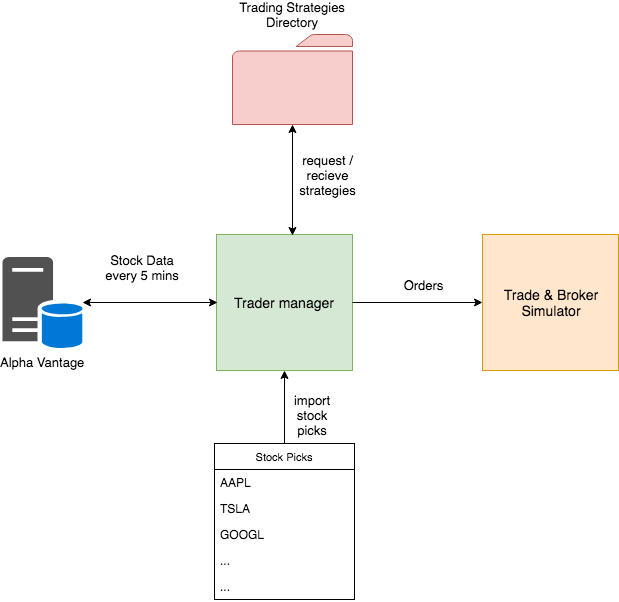
Given the stocks list, the trader manager system is launched to trade on those stocks. Alpha Vantage site is used to get current prices of the stocks from the stocks list. Prices are refreshed every 5 minutes. There is also the Trading Strategies Directory where trading strategies are kept and picked from when the trader manager is launched. Given a stream of stock prices and trading strategies the trader manager decides when and how to buy/short/sell/cover stocks and outputs a list of orders in real time. The Trade/Broker simulator executes these orders using a simulation fund. All trades are kept in a logfile to analyze the trades.
Trading Strategies
A trading strategy is a series of conditions that needs to be met to buy/short/sell/cover stocks. There are many trading startegies like ABCD,momentum,ORB,etc. For this project i’ve used ORB strategy.
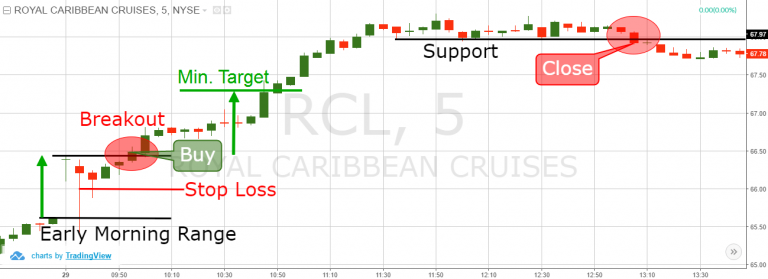 Image taken from tradegsim.com
Trading strategies are written in a function like the following
def initalize_vars(context):
    This is where variables are initalized

    eg. context.a = 10

def handle_data(context,data):
    This is where the strategies are written using the variables in the previous function.

    to access variable a

    print context.a   #prints 10

    to get stock data use

    data.iloc[-1] to get current price of a stock.
The Webclient
Here is the screeshot of the web application
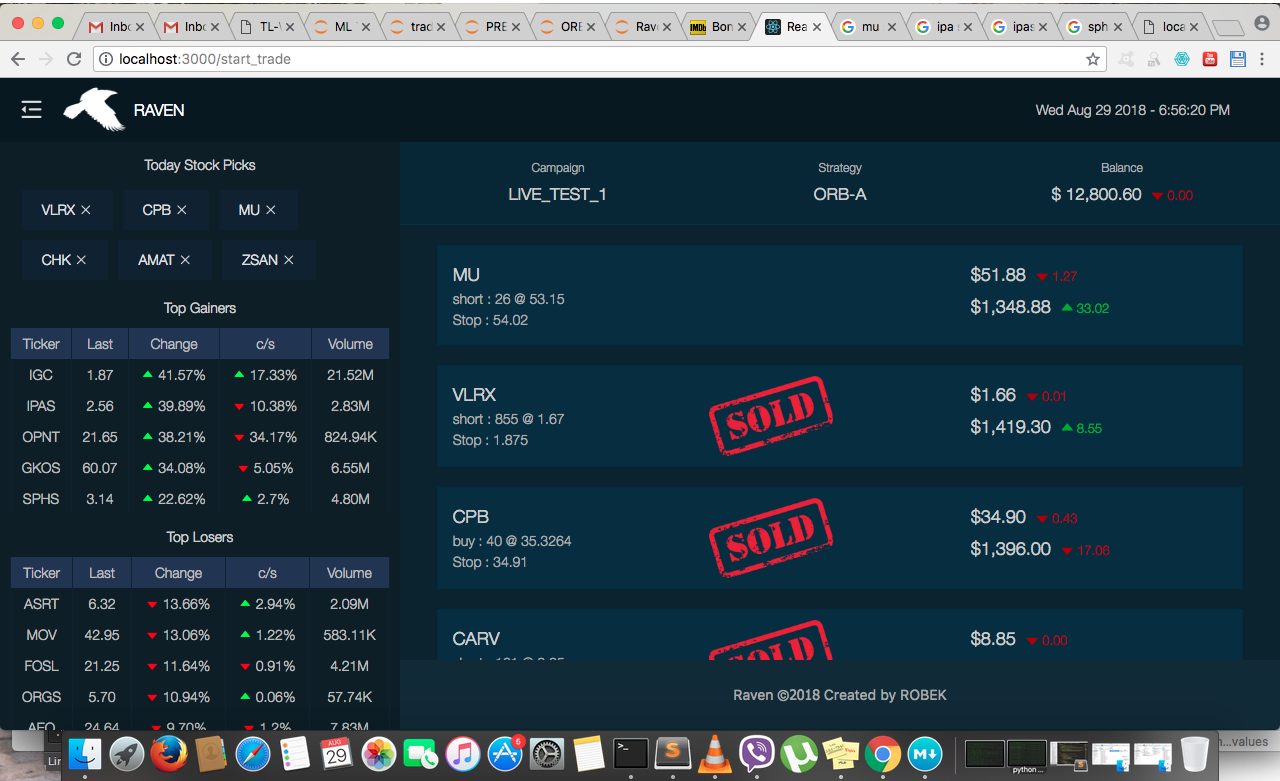
The top Left displays stock picks for that day. The middle and botom left contains the screener data from finviz. The top page displays campaign,strategy and balance. Every campaign has it’s own trading strategy and fund. And the right side contains stocks that are currently being traded. Every list on the trade shows the current price, the price and number of shares the stock is bought or shorted, if it’s making or losing money and the stop price. Once a stock is sold or covered, it’s stamped with a sold image.